.NET - ADO.NET Entity Framework & LINQ to Entities - deel 2
- Datum:
- Auteur: Stefan Cruysberghs
- Deze pagina is enkel in het Engels beschikbaar
In part 1 of this series of articles about the Entity Framework I already covered the following topics :
- The Entity Framework
- Installation
- Generate an Entity Data Model
- The Entity Data Model (EDM)
- Entity SQL
- ObjectQuery queries which return entity types
- ObjectQuery queries with parameters
- ObjectQuery queries which return primitive types
- ObjectQuery queries which return anonymous types
- EntityCommand queries which return entity types
- EntityCommand queries which return anonymous types
- EntityCommand queries with parameters
- LINQ to Entities
This article will cover a few testing/learning/debugging tools and some techniques on how to view the generated T-SQL statements :
- View SQL statements
- SQL profiling tools
- Microsoft SQL Server Profiler
- AnfiniL's SQL Express Profiler
- ToTraceString method
- Entity SQL : EntityCommand.ToTraceString()
- Entity SQL : ObjectQuery.ToTraceString()
- LINQ to Entities : (query as ObjectQuery).ToTraceString()
- SQL profiling tools
- Tools
Part 3 will cover :
View SQL statements
In part 1 of my Entity Framework articles I showed how to query the Entity Data Model with Entity SQL and LINQ to Entities. The Entity Data Model is an conceptual model but internally all Entity SQL and LINQ to Entities queries will be translated to T-SQL queries which will retrieve data from the database. Before going any further with demonstrating new querying examples, I would like to cover some techniques which will enable you to view these generated T-SQL statements. It is a good idea to take a closer look at these T-SQL statements when learning the Entity Framework querying techniques or when debugging your EF applications.
SQL profiling tools
Contrary to LINQ to SQL, the ObjectContext class does NOT have a Log property nor a general logging mechanism. So at this moment there is no way to trace all T-SQL statements within Visual Studio.
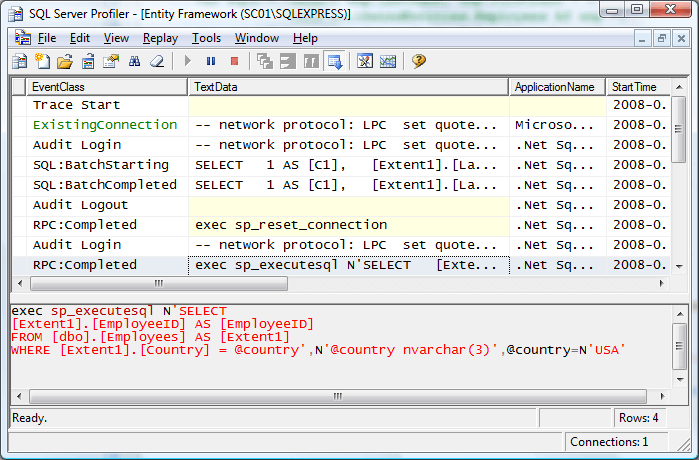
If you want to view all executed T-SQL statements you need to utilize an external SQL profiling tool. One of these profiler tools is the Microsoft SQL Server Profiler which is included in the Developer Edition of SQL Server. Just start a new trace and specify the database and the events (e.g. SQL:BatchCompleted) you would like to log.
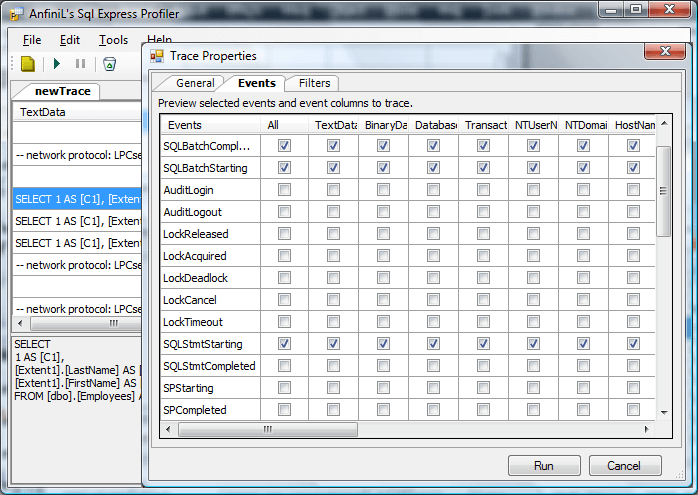
If you are using an Express edition of SQL Server than the SQL Profiler will not be available. Fortunately there is an open-source alternative created by Nikolay Zhebrun. The AnfiniL's SQL Express Profiler also provides all necessary features such as choosing events to profile, setting filters, ...
One of the great promises of the ADO.Net Entity Framework is that it will support various databases like Oracle, MySQL, DB2, Firebird, ... At this moment you will need a profiling tool for each type of database. I really hope that Microsoft will implement some kind of general logging mechanism for the Entity Framework so we don't need all these external tools when debugging our applications.
ToTraceString method
There is also another way to view the generated T-SQL statement of one specific query. Both the EntityCommand and the ObjectQuery classes have a ToTraceString() method. In some cases this can be handy to see what is going on internally without the need of a profiling tool. It is important to note that ToTraceString() doesn't actually execute the query, it only converts the query to a SQL statement.
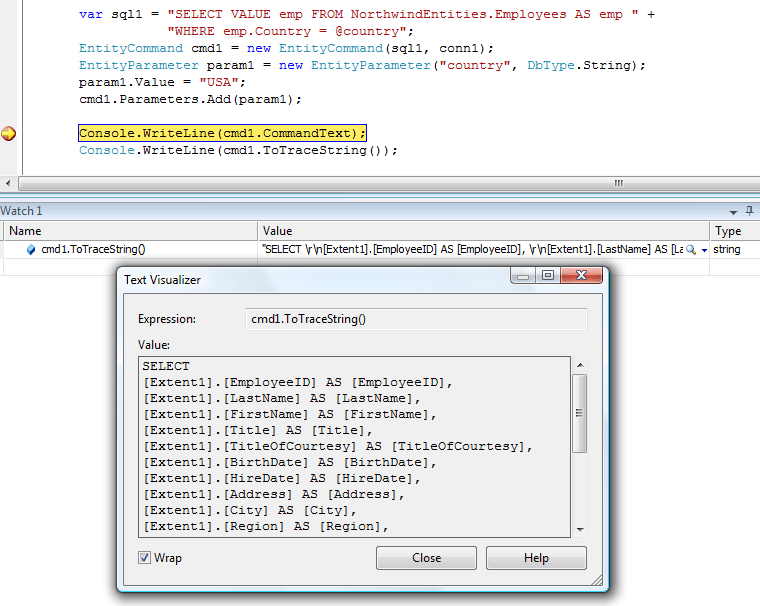
By adding a watch you can easily view the SQL statement. Keep in mind that the connection should be open otherwise the ToTraceString() method will raise an InvalidOperationException (Execution of the command requires an open and available connection. The connection's current state is closed.)
Now I will show a ToTraceString-example for each querying technique of the Entity Framework.
Entity SQL : EntityCommand.ToTraceString()
NorthwindEntities context = new NorthwindEntities();

EntityConnection conn = new EntityConnection(context.Connection.ConnectionString);

var sql = "SELECT VALUE emp FROM NorthwindEntities.Employees AS emp " +
          "WHERE emp.Country = @country";
EntityCommand cmd = new EntityCommand(sql, conn);
EntityParameter param = new EntityParameter("country", DbType.String);
param.Value = "USA";
cmd.Parameters.Add(param);


if (cmd.Connection.State != ConnectionState.Open)
  cmd.Connection.Open();
Console.WriteLine(cmd.ToTraceString());
Entity SQL : ObjectQuery.ToTraceString()
NorthwindEntities context = new NorthwindEntities();

var sql = "SELECT VALUE emp FROM NorthwindEntities.Employees AS emp " +
          "WHERE emp.Country = @country";
var query = context.CreateQuery<Employee>(sql);
query.Parameters.Add(new ObjectParameter("country", "USA"));

if (context.Connection.State != ConnectionState.Open)
  context.Connection.Open();

Console.WriteLine(query.ToTraceString());
LINQ to Entities : (query as ObjectQuery).ToTraceString()
You should typecast a LINQ to Entities query (IQueryable) to an ObjectQuery to be able to call the ToTraceString() method.
NorthwindEntities context = new NorthwindEntities();

string country = "USA";
var query = from e in context.Employees
            where e.Country == country
            select e;

if (context.Connection.State != ConnectionState.Open)
  context.Connection.Open();
Console.WriteLine((query as ObjectQuery<Employee>).ToTraceString());
By using reflection and the Invoke() method you could drop the typecasting to get the same result.
Console.WriteLine(query.GetType().GetMethod("ToTraceString").Invoke(query, null));To simplify this, use one of the great C# 3.0 features, namely extension methods. Create a new ToTraceString extension method for the IQueryable class.
public static class LINQExtensionMethods
{
  public static string ToTraceString(this IQueryable query)
  {
    System.Reflection.MethodInfo toTraceStringMethod = query.GetType().GetMethod("ToTraceString");

    if (toTraceStringMethod != null)
      return toTraceStringMethod.Invoke(query, null).ToString();
    else
      return "";
  }
}Console.WriteLine(query.ToTraceString());
Tools
eSqlBlast
Zlatko Michailov, who is the program manager at Microsoft, has created a nice tool called eSqlBlast. It is definitely worth a look when you are learning Entity SQL. The tool can be downloaded from CodePlex. eSqlBlast is a suite of five assemblies and one of them is a WinForms application : Microsoft.Samples.Data.eSqlBlast.WinShell.exe.
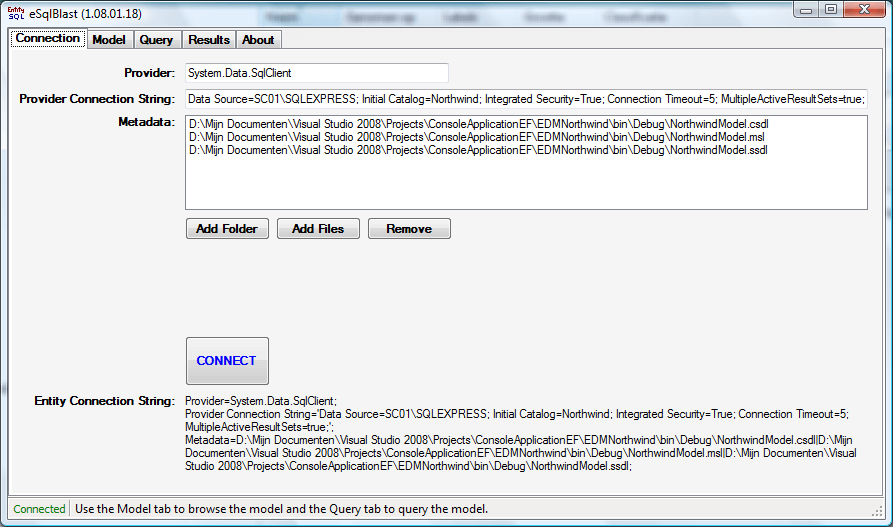
The first tabsheet Connection has to be used to specify the 3 metadata files (CSDL, SSDL and MSL) and the connection string. You can copy this connection string from the configuration file (App.config) of your Entity Framework project. Press the Connect button to see if a connection can be established. Version 1.08 has a small bug. When the connection fails, the Connect button will be disabled. When this happens, you have to restart the application.
The Model tabsheet can be used to browse all EntitySets and EntityTypes.
You can enter an E-SQL statement on the tabsheet Query. You will notice that there is an IntelliSense feature. This is even better than Visual Studio which has no IntelliSense when writing E-SQL string expressions.
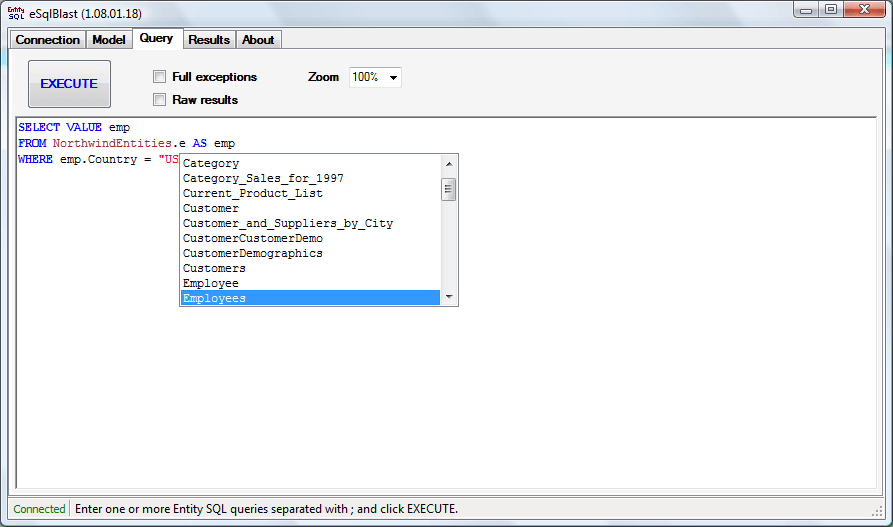
Press the Execute button and the results will be displayed in a HTML view on the next tabsheet Results. This results page will show 4 sections :
- Entity Command : the Entity SQL statement (=CommandText property)
- Store command : the generated T-SQL statement (=ToTraceString() method)
- Record Count : the number of results
- Data : the result data
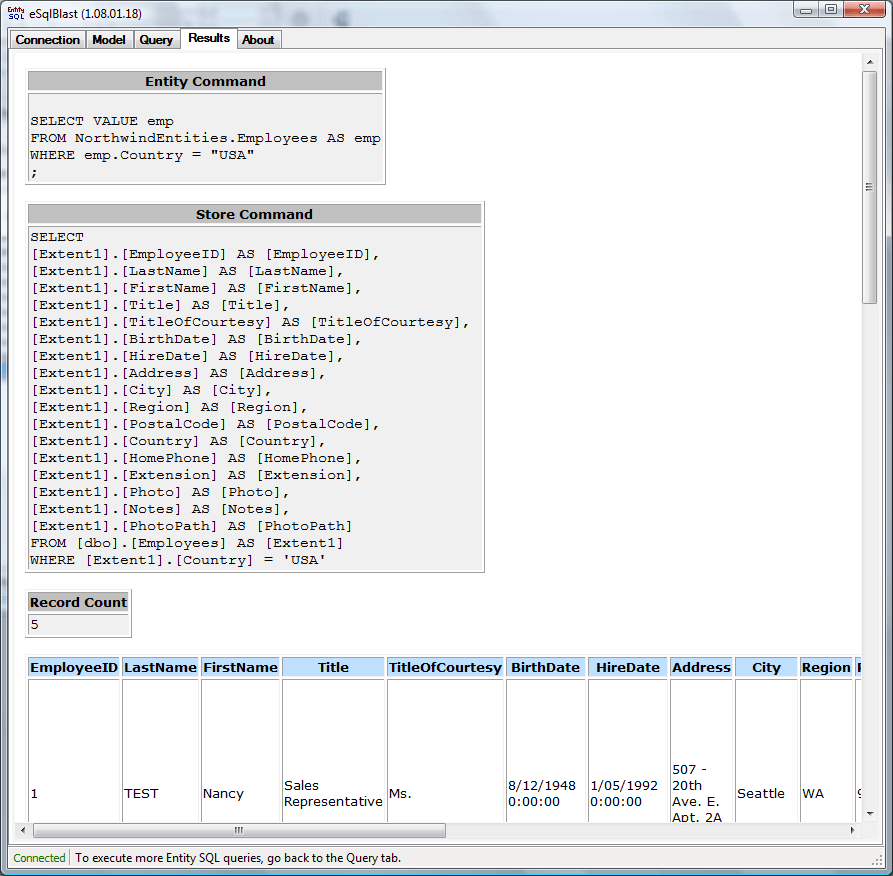
LINQPad
In previous articles I already stated that I really like the free LINQPad tool from Joseph Albahari.
LINQPad is a fantastic LINQ expressions testing tool. Originally it was designed to execute LINQ to Objects and LINQ to SQL queries, but it can also be used to execute LINQ to Entities queries.
Just perform the following steps :
1) Open the Advanced Properties (F4) dialog and add a reference to the System.Data.Entity assembly.
2) Add a reference to the assembly with your Entity Data Model (and ObjectContext).
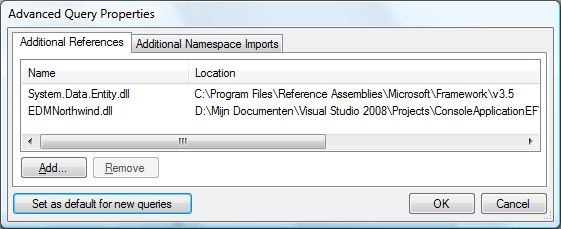
3) Create your ObjectContext object and pass the entity connection string. You could copy this string from the eBlastSql tool. The string consists of 3 parts :
- Provider : ADO.NET data provider (e.g. System.Data.SqlClient)
- Provider Connection String : connection string to your database
- Metadata : full paths to the CSDL/SSDL/MSL files
var context = new NorthwindModel.NorthwindEntities(
  @"Provider=
    System.Data.SqlClient;
  Provider Connection String=
    'Data Source=PCNAME\SQLEXPRESS; Initial Catalog=Northwind;
    Integrated Security=True; Connection Timeout=5; MultipleActiveResultSets=true;';
  Metadata=
    C:\Path\bin\Debug\NorthwindModel.csdl|
    C:\Path\bin\Debug\NorthwindModel.msl|
    C:\Path\bin\Debug\NorthwindModel.ssdl;
  ");
Update 20/10/2008 : In Visual Studio 2008 SP1 the Metadata parameter in the connection string has been extended. For more information check http://msdn.microsoft.com/en-us/library/cc716756.aspx. When the Metadata Artifact Processing property from the EDM is set to Embed in Output Assembly (which is the default) then you have to change the Metadata parameter into Metadata=res://*/. The 3 schemas will be embeded as resources in your assembly so the connection string needs a reference to the resources rather than file paths.
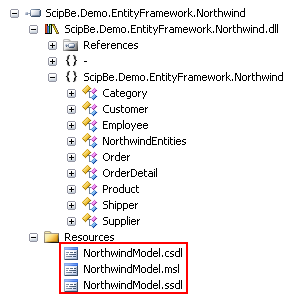
var context = new NorthwindModel.NorthwindEntities(
  @"Provider=
    System.Data.SqlClient;
  Provider Connection String=
    'Data Source=PCNAME\SQLEXPRESS; Initial Catalog=Northwind;
    Integrated Security=True; Connection Timeout=5; MultipleActiveResultSets=true;';
  Metadata=res://*/");
4) Create your query and call the Dump() extension method to show the results.
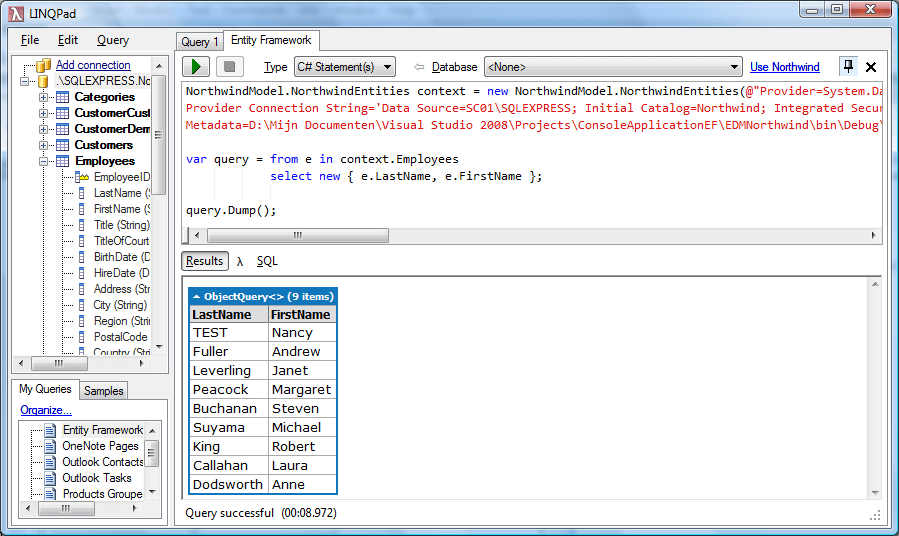
5) If you would like to see the SQL statement which is being executed, just dump the result of the ToTraceString() method (or extension method).
var context = new NorthwindModel.NorthwindEntities(
  @"Provider=
    System.Data.SqlClient;
  Provider Connection String=
    'Data Source=PCNAME\SQLEXPRESS; Initial Catalog=Northwind;
    Integrated Security=True; Connection Timeout=5; MultipleActiveResultSets=true;';
  Metadata=res://*/");

var query = context.Customers.Where(c => c.City == "Berlin");

(query as ObjectQuery<Customer>).ToTraceString().Dump();

query.Dump();
The latest versions of LINQPad have syntax coloring for C#, VB and SQL queries. In the near future this tool will have IntelliSense which will make it even better.
In the next part of my series about the ADO.NET Entity Framework I will show you how to modify data, use change tracking and handle concurrency problems. If you have any remarks or suggestions, please let me know.
